
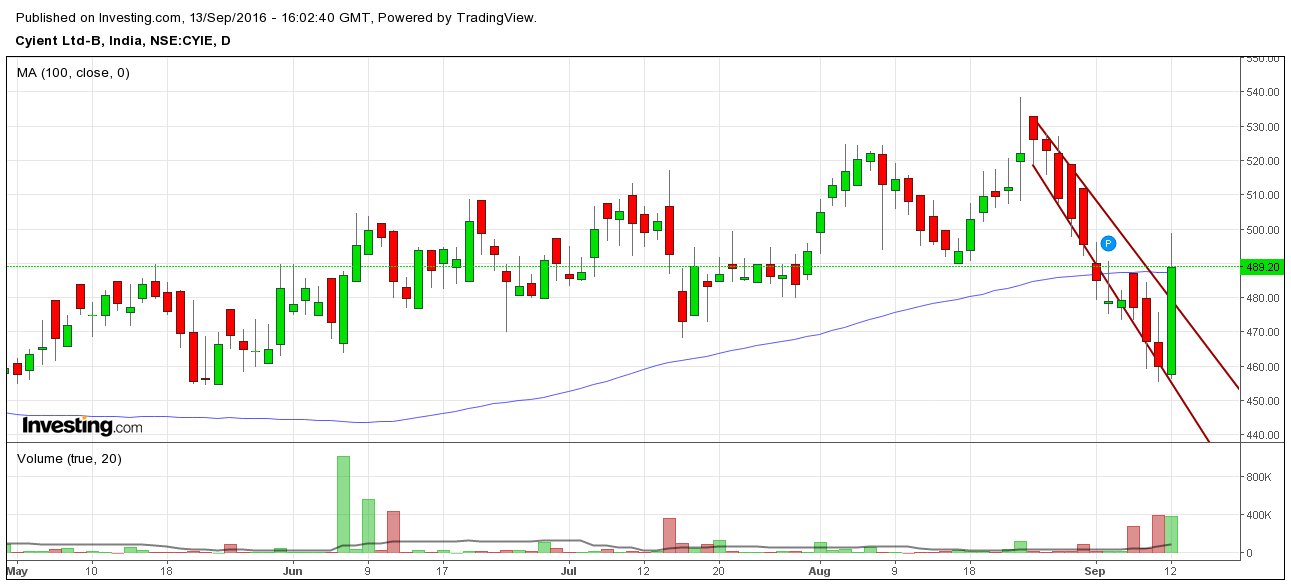
Cyient on a daily chart stock price was trading in a
southward direction, but on monday stock price reverted up, we witnessed a
double bottom pattern, indicate rally will continue towards north. Also on
daily chart stock price was trading below 50 DMA from last 6 days, but on Monday
price closed above 50 DMA, which add more bullishness for the stock price.
If one were to
go by the volume data, a higher upswing is seen on the stock price. Trader or
investor can accumulate for the target of Rs. 532/605 level, with Rs.468 stop
loss on closing basis.


No comments :
Post a Comment