Friday 30 September 2016

GP Petroleums Ltd – Closed near the breakout (Entry Price: 84.70)

No comments :
GP Petroleums Ltd on a daily chart stock price is trading above 20 DMA & 50 DMA, indicate stock is well placed above the support level. On a weekly chart stock has formed the rounding pattern and its closed at the breakout, any trade above 84.70 stock price can rally more than 30 percent, indicate rally will continue towards north. Momentum oscillator MACD uptrend is intact, which add more bullishness for the stock price.


If one were to go by the volume data, a higher upswing is seen on the stock price. Trader or investor can accumulate above Rs. 84.70 for the target of Rs. 115 levels, with Rs.73 stop loss on closing basis.


Endurance Tech IPO – Important Takeaways

No comments :
Scheduled to Open from 5-7 October.
Price Band.                                         Rs.467-472
Issue size.                                           Rs.1162 crores
OFS of.                                                 17.5%
Market cap at upper Band.          Rs. 6640 crores.

Anurang Jain is first gen entrepreneur who runs the show from last 30 years.
He started operations in year 1985-86 at Aurangabad with Bajaj Auto.
Today Endurance is OEM Suppliers for large companies with 18 manufacturing facilities in India and 7 facilities in Europe.

Geographical break up of revenues.
India.                     70%
Europe                   30%

Product wise
Aluminium die casting.  63%
Suspension                         22%
Transmission                      5.5%
Braking system                 4.6%
After sales                          3.3%

Focussed R&D player with total strength of 167 people and last year spend total 1.3% of sales equivalent to 48 crores.

India business is virtually debt free and run on sub 12.5% margin
With European business which fully acquired in year 2006 garnering 15.6%.

Going ahead company and Mr.Anurang Jain is very clear about maintain current healthy Return ratios of 20% and above.
Some key areas n takeaways from meet are as follows

  • ·         Focus on European business as there they do complex casting works for companies like Fiat n Daimler and so garnered 15% plus margins.
  • ·         R&D is big focus area.
  • ·         Aftermarket sales is healthy 17% margin business which growing at sub 18-19% is other focus.
  • ·         Focussing on improving operational efficiencies by having multi product plant, automation technique used extensively which not only saving cost but also maintaining quality, by consolidation of plants.
  • ·         Successfully reducing debt equity ratio to 0.4x from 0.6x.
  • ·         European business runs at almost full capacity while Indian operations are sub70%..
  • ·         By 2018 developing in-house testing facility for their product at Aurangabad which helps them to gain confidence from OEM.
  • ·         As of now Bajaj auto contributes 40.8% of total revenues.
  • ·         Going ahead having focus on 2&3 wheeler in India and for European operations continue to focus on CV and passenger cars.


·         In India not find any interesting acquisition target but focus is more towards European market for acquisition.
·         100% hedge their forex exposure.
At last can say Mr. Anurang Jain is running the entire show and having a very deep understanding about industry and very focused to adopt newer technologies as well as keep open to invest in R&D facilities to come out with newer product which makes help them to do value engineering for OEMs.

Some statistics FY16
Total sales                          5275 Crores
India sales.                         3700 crores
Blended margin                 13.5%
India margin.                     12.5%
Europe margin.                  15.6%
Aftermarket margin.          17.5%
Total Patents.                     4
Waiting for patents.          41.

Thursday 29 September 2016

BASF India Ltd – Closed above the breakout

No comments :
BASF India Ltd on a weekly & monthly chart stock price is making higher highs and high lows pattern with increase in volume, indicate positive outlook for the stock price. On a daily chart we witnessed stock price has given the breakout of cup and handle pattern few days back at Rs. 1177, yesterday stock price has closed above the same, indicate rally will continue towards north. Momentum oscillator MACD uptrend is intact, which add more bullishness for the stock price.


If one were to go by the volume data, a higher upswing is seen on the stock price. Trader or investor can accumulate at Rs. 1190 for the target of Rs. 1310/1363 levels, with Rs.1115 stop loss on closing basis.

Wednesday 28 September 2016

Igarashi Motors India Ltd – Rounding Pattern Breakout

No comments :
Igarashi Motors India Ltd on a daily, weekly & monthly chart stock price is making higher highs and high lows pattern with increase in volume, indicate positive outlook for the stock price. On a weekly chart stock price has given the breakout at Rs.743 of rounding pattern its trading above the same, indicate ongoing rally will continue towards north. Momentum oscillator MACD is rising, which add more bullishness for the stock price.
If one were to go by the volume data, a higher upswing is seen on the stock price. Trader or investor can accumulate at Rs. 783 for the target of Rs. 860/895 levels, with Rs.740 stop loss on closing basis.

Tuesday 27 September 2016

Atul Auto Ltd - Stock Rider

No comments :
With the revival in the economy taking place, the demand for automobile have been picking up. In such scenario, we feel there is one company in automobile space will likely to gain growth momentum. The company we are speaking is about Atul Auto. It is one of the leading manufacture of three wheelers. Company is likely to show better price performance in near term supported by good fundamentals and technical breakout.
 On chart, stock price has volatile trend, hit all-time high at Rs. 584.60 in January 2016, then, price revered to 52 weeks’ low at Rs. 391, in the month of August 2016, down 33.11 percent from the all-time high. Currently, stock price is trading at Rs. 459.70. The stock price seen 17.57 percent rise in the last 1 month, from the 52-week low, indicates the rally will continue towards north.
On a different time, scale i.e. daily and weekly chart, stock price is making higher tops and higher lows pattern and trading above 20SMA (438) and 50SMA (440) respectively, suggesting it has potential up move in upcoming trading sessions, indicate positive outlook for the stock.

Yesterday on a daily chart it also broken out of the bullish pattern of inverted head and shoulder pattern at Rs. 448 level and it’s moving towards northward direction, which will take it towards Rs. 524 level. Applying other indicator on the chart like Bollinger Band (BB) we find stock price at. Rs. 459.95 is trading above the mid band of BB at Rs. 438, besides band is widening, indicating positive momentum.
Also we witnessed a breakout of long downward sloping trend line at Rs.448, indicate rally will continue for another few months. Momentum Oscillator, MACD (Moving Average Convergence & Divergence) on a daily chart, has given the positive crossover, favouring the bullish view, which could witness the Atul Auto marching higher.
RSI (Relative Strength Index) 14-week on a weekly and monthly chart are in rising mode and not yet overbought, which has more room left on upside. The 14-week RSI also trade above its 9-week EMA, which is positive signal, indicate better perform in the weeks to come.

The trend intensity indicator demonstrates that the stock is gaining strength as months’ pass by. The psychological sentiment towards the stock remains positive. The stock is also looking positive on the weekly chart, which foretells well for the long term uptrend of the stock. We believe the stock has the potential to move higher in the coming weeks and therefore recommend a buy at CMP and adding more on dips. 


Tata Global Beverages Ltd – Ascending Triangle Breakout

No comments :
Tata Global Beverages Ltd on a daily & weekly chart stock price is making higher highs and high lows pattern with increase in volume, indicate positive outlook for the stock price. On a daily chart stock price has given the breakout at Rs.144 of ascending triangle pattern and its closed above the same, indicate ongoing rally will continue towards north. Momentum oscillator MACD has given the positive crossover, which add more bullishness for the stock price.


If one were to go by the volume data, a higher upswing is seen on the stock price. Trader or investor can accumulate at Rs. 145 for the target of Rs. 158/166 levels, with Rs.138 stop loss on closing basis.


Monday 26 September 2016

Indian Oil Corporation Ltd – Ascending Triangle Breakout (Entry Price: 592)

No comments :
Indian Oil Corporation Ltd or IOC on a daily, weekly & monthly chart stock price is making higher highs and high lows pattern with increase in volume, indicate positive outlook for the stock price. On a daily chart stock price has given the breakout at Rs. 582 of ascending triangle pattern and its closed above the same, indicate ongoing rally will continue towards north. Momentum oscillator MACD has given the positive crossover, which add more bullishness for the stock price.


If one were to go by the volume data, a higher upswing is seen on the stock price. Trader or investor can accumulate at Rs. 593 for the target of Rs. 635/648 levels, with Rs.576 stop loss on closing basis.

Sunday 25 September 2016

Blue Star: A Good Long Term Buy

No comments :
Blue Star limited is an Indian company which engaged in business of central air conditioning and commercial refrigerator. It fulfils the air conditioning needs of corporate and commercial customers and has commercial refrigeration equipment ranging from water coolers to cold storage. The Company has also started offering Electrical Contracting and Plumbing & Fire Fighting Services. Blue Stars other businesses include marketing and maintenance of hi-tech professional electronic and industrial products.
As regards the segments it operates in following three major segments Viz- electromechanical projects and packaged air conditioning, cooling products and professional electronics. While in the cooling products segment we are bullish on consumption led demand driven by factors like increased spending capability and good new product offerings.
In the Electromechanical projects segment the order book has been good at Rs 1776 crore as on June 2016. This is a good 19 percent appreciation on Y-o-Y basis. We expect a very good order inflow going ahead as well led by the sectors like IT & ITES, Infrastructure, Retail and office. We are confident that the economic growth would be better in H2FY17 and hence all the segments it caters to would stand beneficiary of the same.
On the financial front the company posted strong results for June 2016 quarter. On consolidated basis it posted a topline of Rs 1216.81 crore and bottomline of Rs 50.42 crore as against Rs 1167 crore and Rs 14.31 crore posted in March 2016.
Management has also provided positive outlook. Management suggested that “The normal monsoon in most parts of the country is likely to enhance demand for unitary products, especially from Tier 3/4/5 towns. Middle class consumer spends continue to be on the rise and the festive season is anticipated to trigger greater sales of consumer durables. Though the Electro-Mechanical projects business as well as the Professional Electronics & Industrial Systems business remain slow-growing due to lacklustre investment, the Unitary Products business is expected to drive overall growth. The addition of new product lines such as water purifiers, air purifiers and air coolers will further help the Company to maintain revenue growth and better results for the rest of the year”.
With Strong order book, expected improvement in margins and last but not the least traction in most of the segments it caters to, expect a good run for Blue Star on bourses.

Friday 23 September 2016

The Ramco Cements Ltd – Parallel Channel (Entry Price: 618)

No comments :
Ramco Industries Ltd on a daily, weekly & monthly chart stock price is making higher high and high low pattern with increase in volume, indicate positive outlook. On a weekly chart stock price is trading in a perfect parallel channel, in the channel stock price has bounce back from the lower channel now its heading towards north to touch the upper channel, which add more bullishness for the stock price.

If one were to go by the volume data, a higher upswing is seen on the stock price. Trader or investor can accumulate at Rs. 618 for the target of Rs. 648/664 levels, with Rs.590 stop loss on closing basis.


Thursday 22 September 2016

Bharti Infratel Ltd – Rounding Pattern Breakout

No comments :
Bharti Infratel Ltd on a daily chart stock price has given the breakout of the rounding pattern and its closed above the same. Also 3 days back stock has also given the breakout of the symmetrical triangle pattern, indicate rally will only continue towards north. Stock price is making higher high and high low pattern which add more bullishness for the stock price.  


If one were to go by the volume data, a higher upswing is seen on the stock price. Trader or investor can accumulate at Rs. 375 for the target of Rs. 398/408 levels, with Rs.360 stop loss on closing basis.


Wednesday 21 September 2016

Arvind Ltd – Inverted Hammer (Entry Price: 333)

No comments :
Arvind Ltd on a daily chart stock price has formed the inverted hammer pattern, indicate stock price will reverse after falling two days. It would be a reversal for stock price, buying happen yesterday at lower low which give confirmation for buy. Also on daily chart this week stock price has given breakout at Rs. 333 level of ascending triangle pattern and price is trading near the breakout which add bullishness for the stock price. 


If one were to go by the volume data, a higher upswing is seen on the stock price. Trader or investor can accumulate at Rs. 333 for the target of Rs. 355/363 levels, with Rs.324 stop loss on closing basis.


Tuesday 20 September 2016

Pfizer Ltd – Cup and Handel Breakout

No comments :
Pfizer Ltd on a daily chart stock price this week has given a breakout of Cup and Handel pattern, and price is trading near the breakout, indicate bullish rally has been resume. Also this week price has bounce back from the 20 DMA, indicate price is well placed above the support level. Momentum oscillator RSI has more room left on upside, which add more bullishness for the stock price.


If one were to go by the volume data, a higher upswing is seen on the stock price. Trader or investor can accumulate at Rs. 2014 for the target of Rs. 2114/2150 levels, with Rs.1963 stop loss on closing basis.

Monday 19 September 2016

Uflex – A Great Package For Long Term

No comments :
Uflex, is India-based flexible packaging company. If we take a look at the business activity, UFLEX is engaged in manufacture in-house Polyester chips, BOPET / BOPP / COATED / METALLISED / CPP Films, Packaging machines, converting equipment, inks, adhesives, Flexible Laminates and Pouches. Uflex has the unique advantage to deliver customized solutions due to its full backward integration into Films (BOPET, BOPP, CPP, Metalized Films), Chemicals (Inks, Coatings, Adhesives), Engineering (Converting & Packing Equipment’s), Holography (Films, Labels) and Cylinders (Electronic, Laser and Flexographic Plates).

On the financial front the company has been a consistent performer with a steady growth on bottom-line front. For FY16 it posted a topline of Rs 312.29 crore as against Rs 251.04 Crore in FY15. Further the performance was good in June 2016 quarter as well. Company’s net profit for June 2016 quarter stood at On valuation front the stock is trading at just 6.5x of its trailing four quarter earnings.
Currently the scrip is trading at Rs 291. 

SMS Pharmaceuticals Ltd – Range bound Breakout

1 comment :
SMS pharma on a daily chart stock price was trading in a range bound (Rs. 98- Rs. 87) from last five months, yesterday price has breached the level on upside, and closed above the same, indicate bullish rally has been resume. Momentum oscillator RSI has more room left on upside, MACD has given the positive crossover, which add more bullishness for the stock price.


If one were to go by the volume data, a higher upswing is seen on the stock price. Trader or investor can accumulate at Rs. 98.65 for the target of Rs. 107/119 level, with Rs. 94 stop loss on closing basis.


Saturday 17 September 2016

Cox & Kings Ltd – Rounding Pattern.

3 comments :
Cox & Kings Ltd on a daily chart stock price at Rs. 229.65 is near to give the breakout at Rs. 233.50 of the rounding pattern, any trade above Rs. 233.50 price will take it towards Rs. 276/313 level. Momentum oscillator RSI has more room left on upside, which add more bullishness for the stock price.


If one were to go by the volume data, a higher upswing is seen on the stock price. Trader or investor can accumulate above Rs. 233.50 for the target of Rs. 276/313 level, with Rs. 204 stop loss on closing basis.


Thursday 15 September 2016

Raymond Ltd – Rounding Pattern Breakout

No comments :
Raymond Ltd on a daily chart stock price at Rs. 464.20 has given the breakout at Rs. 462 of the rounding pattern with increase in volume, indicate ongoing rally will continue towards north. Momentum oscillator RSI has more room left on upside, which add more bullishness for the stock price.


If one were to go by the volume data, a higher upswing is seen on the stock price. Trader or investor can accumulate at current level for the target of Rs. 495/522 level, with Rs. 452 stop loss on closing basis.

Wednesday 14 September 2016

GNFC – Symmetrical Triangle Breakout

No comments :
Gujarat narmada valley fertilizers & chemicals ltd. on a daily chart stock price has given the breakout of the symmetrical triangle pattern with increase in volume, indicate ongoing rally will continue towards north. Momentum oscillator MACD is on the verge to give positive crossover, which add more bullishness for the stock price.


If one were to go by the volume data, a higher upswing is seen on the stock price. Trader or investor can accumulate for the target of Rs. 177/188 level, with Rs. 155 stop loss on closing basis.

Tuesday 13 September 2016

Cyient– Double Bottom Pattern

No comments :
Cyient on a daily chart stock price was trading in a southward direction, but on monday stock price reverted up, we witnessed a double bottom pattern, indicate rally will continue towards north. Also on daily chart stock price was trading below 50 DMA from last 6 days, but on Monday price closed above 50 DMA, which add more bullishness for the stock price.


If one were to go by the volume data, a higher upswing is seen on the stock price. Trader or investor can accumulate for the target of Rs. 532/605 level, with Rs.468 stop loss on closing basis.

Sunday 11 September 2016

Nifty Update: Nifty at Panic Channel Lows, Bulls could protect it for a smart bounce...

No comments :
Nifty:

Good Morning all...

If you were to draw a trend line connecting two panics for the year (the budget day panic low of 6825 and June 24th Brexit panic lows) it corresponds to today's low as of now (10:15 am). Bulls are not going to let their gains go off in a single shot, they will try to protect it and a smart bounce from these lows are not ruled out. While the medium term outlook remains firm for a correction of 10% - 15% as communicated last week, short term bounce towards 8900 is not ruled out. In fact, this correction is most likely to be enjoyed by Bulls rather than the Bears. Let's tune into the game of Bulls v/s. Bears.

Note: If Bulls fails to hold the panic trend line bottom, there comes a strong support zone of 8540 - 8570. 

Friday 9 September 2016

IDBI Bank Ltd– Cup and Handel Pattern

No comments :
IDBI Bank on a daily chart stock price is making higher high and higher low pattern with increase in volume, indicate positive outlook. Also stock price has given the breakout of cup and handel pattern, indicate rally will only continue towards north.


If one were to go by the volume data, a higher upswing is seen on the stock price. Trader or investor can accumulate for the target of Rs. 91 level, with Rs.77 stop loss on closing basis
.

Thursday 8 September 2016

Sun Pharmaceutical Industries – Breakout of Rounding Pattern

No comments :
Sunpharma on a daily chart stock price is making higher high and higher low pattern with increase in volume, indicate positive outlook. On an intraday 1-hour chart, stock price has given the breakout of rounding pattern, indicate rally will only continue towards north.


If one were to go by the volume data, a higher upswing is seen on the stock price. Trader or investor can accumulate for the target of Rs.853 level, with Rs.788 stop loss on closing basis.


Wednesday 7 September 2016

Glenmark Pharmaceuticals – Breakout of ascending triangle pattern.

No comments :
Glenmark Pharmaceuticals Ltd on a daily chart stock price is making higher high and higher low pattern with increase in volume, indicate positive outlook. Stock price is on the verge to give breakout of ascending triangle pattern, any trade or closed above Rs. 878 stock price will rally towards 949 level, further Rs. 990, indicate rally will only continue towards north.


If one were to go by the volume data, a higher upswing is seen on the stock price. Trader or investor can accumulate for the target of Rs.949/990 level, with Rs.832 stop loss on closing basis.


Tuesday 6 September 2016

Munjal Showa Ltd - Technical Brekout

No comments :
Munjal Showa Ltd is the pioneering global leaders in the manufacture of shock absorbers and struts for leading two-wheelers and four-wheelers. This company is one of the largest suppliers of shock absorbers to major auto giants in India, Japan, Germany, US, UK etc. Munjal Showa is likely to show better price performance in near term supported by good fundamentals and technical breakout.
 On chart, stock prices are volatile. The stock hit 52-weeks’ high of Rs. 212 in January 2016, then price revered to 52 weeks’ low of Rs. 150.05, in the month of February 2016, down by 29.22 percent from its 52-weeks’ high. Currently, stock price is trading at Rs. 198.50. The stock price witnessed 32.28 percent rise in the last seven months, from the 52-week low. We feel that there is still some steam left and the rally is likely to continue.
Technically on a different time scale of daily & weekly chart stock price is making higher tops and higher bottoms pattern. Tracking Bollinger Band front price of. Rs. 198.50 is ridding the ‘Upper Bollinger Band’ and also the bands are widening, indicate ongoing positivity will continue in the stock price.
On a daily chart a symmetrical triangle or continuation pattern and stock price of Rs. 198.50 has given a breakout above the upper trend line of the pattern of. Rs.185, with sharp increase in volumes, indicate rally will continue for the multi month towards Rs. 250 level, which is 25 percent.

The positive crossover spotted in moving average convergence divergence or MACD (a momentum and trend indicator) also suggest the formation of the next big move up in the stock over the next few months. RSI, which indicates inherent strength, it has more room upside, which adds further positivity to the index.  Most of the oscillator based indicators also point towards the bullish view of the stock price.

Looking towards the chart pattern and study i.e. Bollinger Band, RSI and MACD, we believe stock price may extend its rally towards Rs. 249/275 levels, whereas Rs.175 will act as a strong support level, which would be on closing basis.


FDC Ltd – Breakout of the range.

No comments :
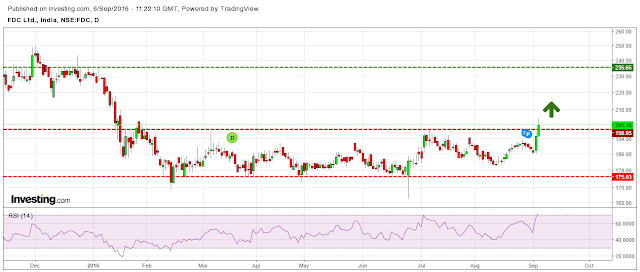
FDC Ltd on a daily chart stock price is making higher high and higher low pattern with increase in volume, indicate positive outlook. Stock price was trading in a range bound (Rs. 199 to Rs.174) from last seven months, yesterday price has breached the level on upside, indicate rally will only continue towards north.

If one were to go by the volume data, a higher upswing is seen on the stock price. Trader or investor can accumulate for the target of Rs.236/248 level, with Rs.182 stop loss on closing basis.


Saturday 3 September 2016

Ceat Ltd – Cup and Handle Pattern Breakout

1 comment :
Ceat Ltd on a daily chart stock price is making higher high and higher low pattern with increase in volume, indicate positive outlook for the stock price. On an intraday 1-hour chart stock price at Rs. 952.70 has given the breakout at Rs. 917 of the cup and handle, indicate on going bullish rally will continue into the stock price which will take is towards Rs.999 Momentum oscillator RSI is rising have more room left on upside, MACD has given positive crossover which add more bullishness for the stock price.


If one were to go by the volume data, a higher upswing is seen on the stock price. Trader or investor can accumulate for the target of Rs.999/1040 level, with Rs. 917 stop loss on closing basis.


Thursday 1 September 2016

Automobile Sales Figures For August 2016 – In Line With Street Estimates

No comments :
With a start to new month Automobile companies announced its sales figures for the month of August 2016. All the companies have posted sales figures in line with street estimates. With M&M posting higher growth in percentage terms. Even Maruti Suzuki backed by its strong growth in utility vehicles segment posted decent growth of 12.20 percent. It was the mid-size cars like Ciaz and Utility Vehicles like Ertiga, Grand Vitara and Vitara Brezza resulted in its good overall show.
Eicher Motors also picked up pace in commercial vehicles sales and we expect the growth to continue going forwards as well.
Ashok Leyland was the only company y witnessing marginal decline of 5.60 percent on Y-o-Y basis. However we expect it to be a temporary phenomenon. Expect Ashok             Leyland volumes to recover in coming month and quarter as a whole.
Following tables show details of company wise sales growth and figures of segmented details of Maruti Suzuki.

Automobile Sales Figure (Units)
Company
Aug-16
Aug-15
% Change
Ashok Leyland
     10,897
     11,544
-5.60%
Eicher Motors
        4,100
        3,611
13.54%
M & M
     13,543
     11,699
15.76%
Maruti Suzuki
   132,211
   117,864
12.17%

Particulars
August
Category : Sub-segment
Models
2016
2015
% Change
A: Mini
Alto, WagonR
35490
37665
-5.80%
A: Compact
Swift, Ritz, Celerio, Baleno, Dzire
45579
41461
9.90%
A: Super Compact
Dzire Tour
2986
3172
-5.90%
A: Mid-Size
Ciaz
6214
4156
49.50%
Total A: Passenger Cars
90269
86454
4.40%
B: Utility vehicles
Gypsy, Ertiga, Grand Vitara, S-Cross, Vitara Brezza
16806
7836
114.50%
C: Vans
Omni, Eeco
12831
12491
2.70%
Total Domestic Passenger Vehicle Sales
119906
106781
12.30%
Light Commercial Vehicles
Super Carry
25
0
-
Total Domestic Sales
119931
106781
12.30%
Total Export Sales
12280
11083
10.80%
Total Sales (Domestic + Export)
132211
117864
12.20%
Particulars
Till August
Category : Sub-segment
Models
2016-17
2015-16
% Change
A: Mini
Alto, WagonR
163264
180218
-9.40%
A: Compact
Swift, Ritz, Celerio, Baleno, Dzire
228166
219766
3.80%
A: Super Compact
Dzire Tour
13841
14451
-4.20%
A: Mid-Size
Ciaz
25066
19629
27.70%
Total A: Passenger Cars
430337
434064
-0.90%
B: Utility vehicles
Gypsy, Ertiga, Grand Vitara, S-Cross, Vitara Brezza
73536
30302
142.70%
C: Vans
Omni, Eeco
64137
58514
9.60%
Total Domestic Passenger Vehicle Sales
568010
522880
8.60%
Light Commercial Vehicles
Super Carry
39
0
-
Total Domestic Sales
568049
522880
8.60%
Total Export Sales
49721
58025
-14.30%
Total Sales (Domestic + Export)
617770
580905
6.30%


Particulars
April'15-March'16
Category : Sub-segment
Models
A: Mini
Alto, WagonR
432977
A: Compact
Swift, Ritz, Celerio, Baleno, Dzire
541951
A: Super Compact
Dzire Tour
38303
A: Mid-Size
Ciaz
54233
Total A: Passenger Cars
1067464
B: Utility vehicles
Gypsy, Ertiga, Grand Vitara, S-Cross, Vitara Brezza
94416
C: Vans
Omni, Eeco
143471
Total Domestic Passenger Vehicle Sales
1067464
Light Commercial Vehicles
Super Carry
-
Total Domestic Sales
1305351
Total Export Sales
123897
Total Sales (Domestic + Export)
1429248