
Monday, 12 December 2016
TCS Ltd– Downward Sloping Trendline.
TCS Ltd on a daily chart stock price is making
higher high pattern with increase in volumes. indicate rally will continue
towards north. On chart, we witnessed stock price Rs. 2210 is trading near downward
sloping trend line any trade or closed above Rs. 2216 stock price can rally
towards previous high swing. Momentum Oscillator RSI has more room left on
upside, which further add bullishness into stock price.
If one were to go by the
volume data, a higher upswing is seen on the stock price. Trader or investor
can accumulate above Rs. 2216 for the target of Rs. 2430 levels, with Rs. 2163
stop loss on closing basis.

Friday, 9 December 2016
ACC Ltd– Downward Sloping Trendline.
ACC Ltd on a daily chart stock price is making
higher high and higher low pattern with increase in volumes. indicate rally
will continue towards north. On chart, we witnessed stock price Rs. 1379.15 has
given the breakout of downward sloping trend line at Rs. 1342 level, show stock
price can rally towards previous high swing. Momentum Oscillator RSI has more
room left on upside, which further add bullishness into stock price.
If one were to go by the
volume data, a higher upswing is seen on the stock price. Trader or investor
can accumulate at Rs. 1379 for the target of Rs. 1497 levels, with Rs. 1335
stop loss on closing basis.

Thursday, 8 December 2016
Bajaj Auto Ltd– Downward Sloping Trend-line.
Bajaj Auto Ltd on a daily chart stock price is
making higher high and higher low pattern with increase in volumes. indicate rally
will continue towards north. On chart, we witnessed stock price Rs. 2780 has
given the breakout of downward sloping trend line at Rs. 2730 level, show stock
price can rally towards previous high swing. Momentum Oscillator RSI has more
room left on upside, which further add bullishness into stock price.

Wednesday, 7 December 2016
Godrej Industries Ltd– Range Breakout
Godrej Industries Ltd on a daily chart stock price
is making higher high and higher low pattern with increase in volumes. indicate
rally will continue towards north. On an intraday 60-minutes chart, we
witnessed stock price was trading in a rangebound, but yesterday price has
breached the level on upside, show stock price can rally towards previous high
swing. Momentum Oscillator RSI has more room left on upside, which further add bullishness
into stock price.
If one were to go by the
volume data, a higher upswing is seen on the stock price. Trader or investor
can accumulate at Rs. 400 for the target of Rs. 430 levels, with Rs. 384 stop
loss on closing basis.

Tuesday, 6 December 2016
ONGC - Technical Breakout
Oil
and Natural Gas Corporation Limited
(ONGC) is an Indian
multinational oil and gas company headquartered
in Dehradun. It is a Public-Sector Undertaking (PSU) of the Government of India,
under the administrative control of the Ministry of Petroleum and Natural Gas. Company is specializing
in the exploration and production of crude oil and gas. The Company has joint
ventures in oil fields in Vietnam, Norway, Egypt, Tunisia, Iran and Australia.
The Group's other activities include deep sea explorations on the east and west
coasts of India, and the exploration of coal bed methane. ONGC is likely to show better price
performance in near term supported by good fundamentals and technical breakout.
On chart, yesterday stock price has hit
52 weeks of Rs. 299.75, also stock price is up by 20% in last 1 month, looks
stock is in spectral uptrend, thus we feel
that there is still some more
left and the rally is likely to continue. On a different time, scale at daily, weekly & monthly chart, stock
price is making higher tops and higher lows pattern and trading above 20DMA (280),
50DMA (275) and 100DMA (255) respectively, suggesting it has potential up move
in upcoming trading sessions, indicate positive outlook for the stock price.
Technically
on daily chart, stock price at. Rs. 298.75 has given a breakout of rounding
pattern at Rs. 297.70 level, and it’s moving towards northward direction,
indicate ongoing bullish rally in the stock price, which will take stock price
towards Rs. 328, which is 10 percent on upside. Applying other indicator on the chart like Bollinger Band (BB) we find
stock price at Rs. 298.75 is ridding the ‘Upper
Bollinger Band’ and the bands are widening, thus
indicating positive momentum.
Momentum
Oscillator, MACD (Moving Average Convergence & Divergence) on higher chart has
given a positive crossover art, favouring the bullish view, which could witness
the ONGC marching higher.
RSI
(Relative Strength Index) 14-week on a weekly and monthly chart are in rising
mode and not yet overbought, which has more room left on upside. The 14-week
RSI also trade above its 9-week EMA, which is positive signal, indicate better
perform in the weeks to come.
If
one were to go by the volume data, then more up move seen on the stock price.
Looking towards the chart
pattern and study i.e. Bollinger Band, RSI and MACD,
we believe stock price may extend its rally towards Rs. 328/348 levels, whereas
Rs.285 will act as a strong support level on a closing basis.

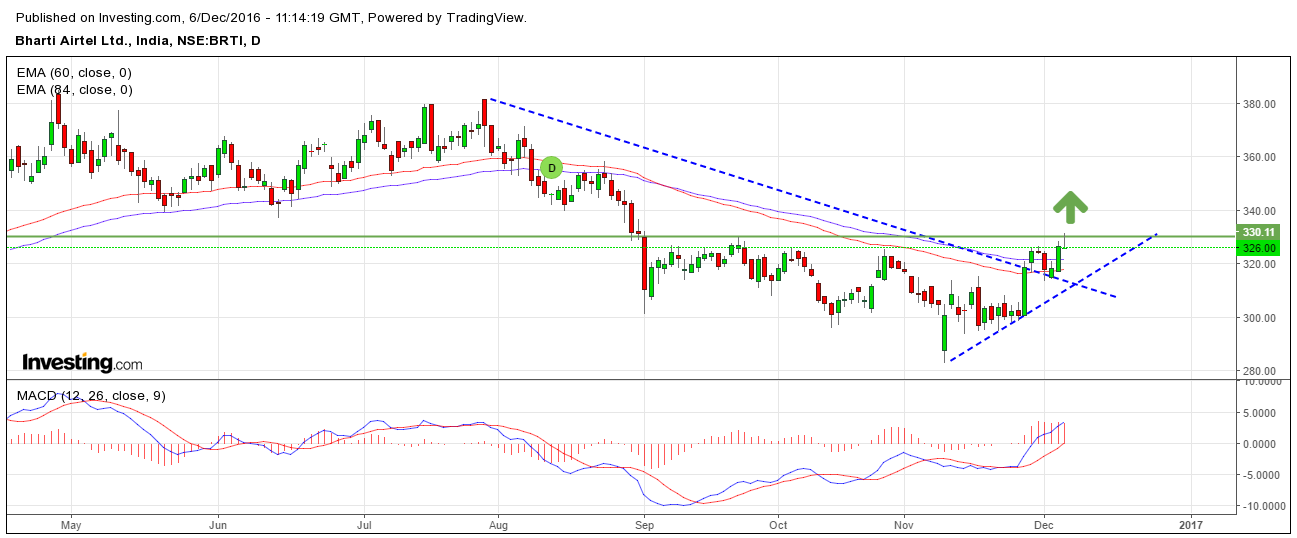
Bharti Airtel Ltd– On the verge of breakout.
Bharti Airtel Ltd on a daily chart stock price is
making higher high and higher low pattern with increase in volumes. indicate rally
will continue towards north. On a chart, we witnessed stock price is trading
near the breakout of rounding pattern, any trade or closed above Rs. 330 level,
stock price can rally towards previous high swing level. Momentum Oscillator
RSI has more room left on upside, which further add bullishness into stock
price.
If one were to go by the
volume data, a higher upswing is seen on the stock price. Trader or investor
can accumulate above at Rs. 330 for the target of Rs. 359 levels, with Rs.
314 stop loss on closing basis.
Friday, 2 December 2016
Eicher Motors Ltd– Closed above 20DMA and 50 DMA
Eicher Motors Ltd on a daily chart stock price is
making higher high and higher low pattern with increase in volumes. indicate rally
will continue towards north. On a chart, we witnessed stock price was trading below
20 DMA and 50 DMA from last 15 trading session but on Friday index has closed
above the same, indicate stock price has find the support level. Momentum
Oscillator MACD has given the positive crossover, which further add bullishness
into stock price.
If one were to go by the
volume data, a higher upswing is seen on the stock price. Trader or investor
can accumulate at Rs.22760 for the target of Rs. 24000/25300 levels, with
Rs. 22200 stop loss on closing basis.

Subscribe to:
Posts
(
Atom
)


